Eye opacity
Eye opacity or cataracts can arise from nutritional, genetic, and environmental factors, as well as exposure to infections, parasites, or ultraviolet light. Cataracts cause lens clouding, leading to impaired vision. This can restrict a fish's ability to feed, avoid aggression or predation, and navigate its environment. As a result, eye opacity can negatively impact survival, growth, and performance.
| Ideal | Acceptable | Warning | Unacceptable |
|---|---|---|---|
|
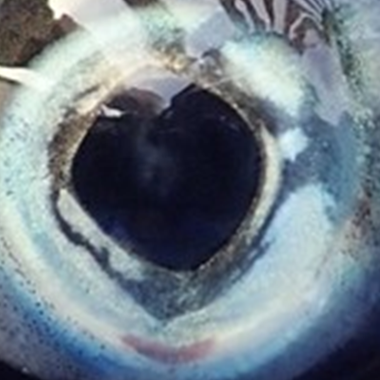
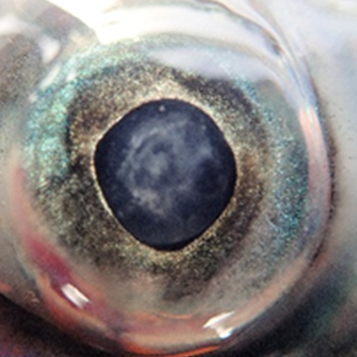
No visible opacity |
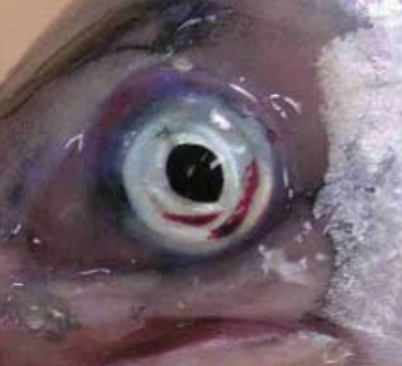
Minor opacity, < 10% lens coverage |
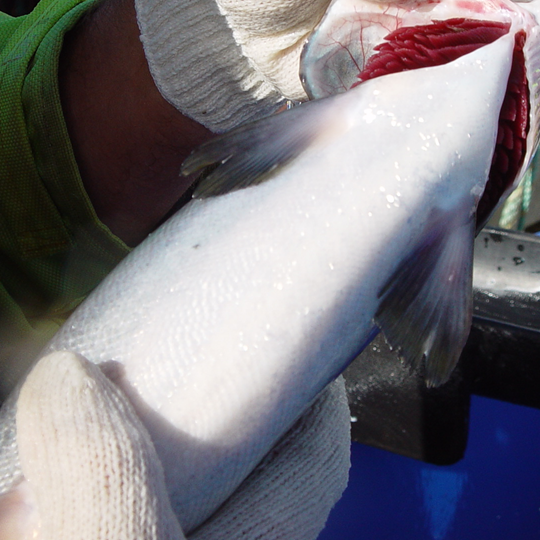
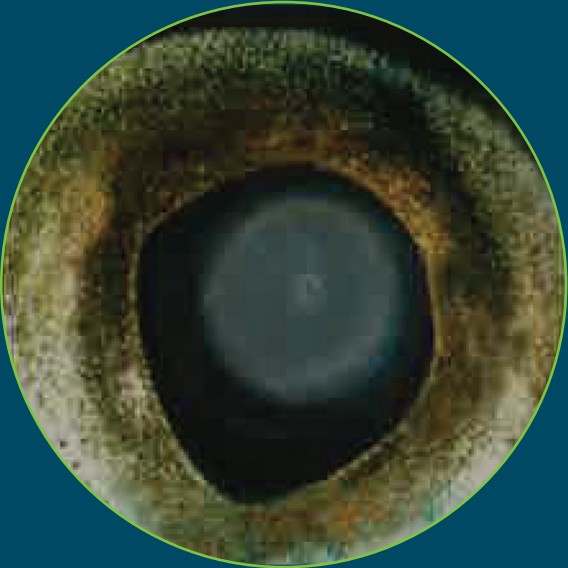
Moderate opacity, 10–50% lens coverage |
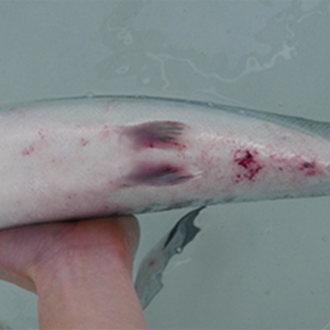
Severe opacity, > 50% lens coverage |
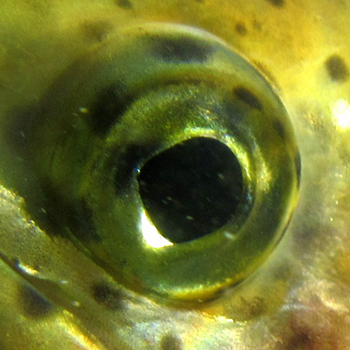
Healthy rainbow trout eye15
|
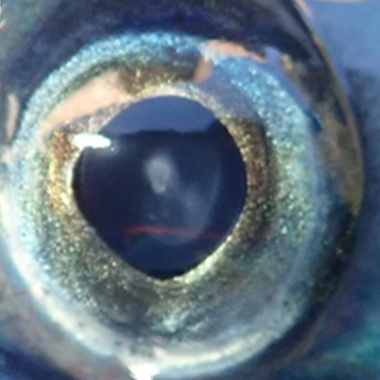
Atlantic salmon eye with minor opacity16
|
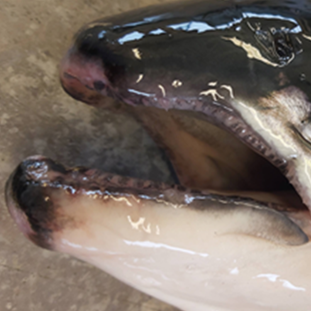
Atlantic salmon eye with moderate opacity17
|
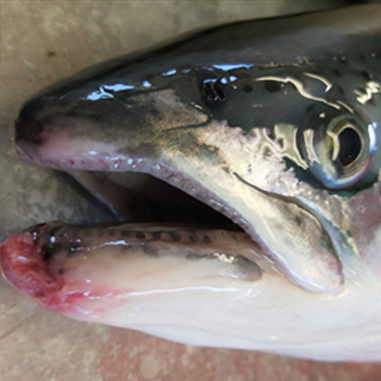
Atlantic salmon eye with severe opacity18
|
Protocol Application
Score based on the most affected eye, though recording both eyes is recommended to improve data quality.
Calculate the distribution of scores across the thresholds within the sample.
Scoring Notes
- For a 'warning' score for opacity, noting whether the opacity is lower (10-25%) or higher (25–50%) supports better management decisions.
- Lower end opacity means the fish likely retains adequate functional vision.
- Higher end opacity means vision may be significantly impaired, approaching welfare concerns.
- While an 'acceptable' opacity score reflects a state of minimal welfare impact, minor cataracts can indicate parasitic infection, metabolic stress, or nutritional problems and should be actively managed to prevent progression.
- Bilateral cases: Where both eyes would be scored as 'warning' or 'unacceptable', vision is likely significantly impaired, posing greater welfare risk than unilateral opacity. Monitoring should be increased where this is observed.
- Validation: This scoring system has not been validated for rainbow trout specifically, but is based on the Laksvel scoring system for Atlantic salmon. Eye anatomy is similar across salmonids, but species-specific validation is needed.
Key Evidence
| Source | Summary of source | Key result |
|---|---|---|
| Kuukka-Anttila et al., 2010 | Experimental study investigating cataract growth in 969 rainbow trout with a natural Diplostomum infection in commercial settings across in both freshwater and seawater sites over a 3-year rearing period. A slit-lamp microscope was used to score cataracts from 0–5, for a total score of up to 10 between both eyes. The fish were measured at three different times: after the first growing season (mean weight 50g, freshwater), after the second growing season (mean weight 734g, both freshwater and seawater) and after the third growing season (mean weight 2245g, freshwater only). | All 969 individuals had cataracts with a mean individual score of 7.5 and a range from 4 to 10. The authors noted that Diplostomum load is directly related to cataract scores, and that the findings suggest that variation in tolerance is determined by genetic factors. Initial body weight was not correlated with cataract score, but cataract severity measured in the second and third timepoints had a strongly negative relationship with body weight, indicating reduced growth and condition in fish with high cataract scores. In females, higher cataract scores were associated with later maturity, though this was not observed in males. There was no clear relationship between cataract severity and mortality. The authors explained that this could be due to the farming conditions: as there were no predators and fish had unlimited access to feed, meaning reduced vision did not result in starvation. |
| Karvonen et al., 2004 | Experimental study investigating cataract formation in response to eye fluke infection (Diplostomum spathaceum) in 160 rainbow trout (1 year old). Trout were exposed to natural infection in Lake Konnevesi over 112 days in cages or in a freshwater laboratory environment. Cataracts were scored using a slit-lamp microscope on a scale from 0–4. | There was a strong relationship between higher parasite loads and more severe cataracts. Under natural lake exposure, cataracts developed gradually, with 35% of eyes fully covered or opaque by day 112. In laboratory exposures, cataracts developed more rapidly; 37% of eyes had a complete cataract and 3% totally opaque by day 29. Cataract intensity remained stable after this time. |
| Remo et al., 2017 | Experimental study investigating the formation of cataracts at different temperatures in 80 post-smolt rainbow trout (125g) over 35 days in laboratory seawater conditions. Two temperatures were tested: 13°C and 19°C. Each lens was scored between 0–4, with a total score between 0–8 per fish. A score of 0 = no opacity, 1 = < 10% opacity, 2 = 10–50% opacity, 3 = 50–75% opacity and 4 = 75–100% opacity. | At the start of the study, rainbow trout had a cataract prevalence of 10%, with a mean cataract score of 0.1. In the 13°C group, the prevalence was 53% and the mean score was 0.9, and in the 19°C group the prevalence was 67% and the mean score was 1.3. The authors concluded that the trout's higher concentrations of N-acetyle-histidine and histidine made them less susceptible to cataracts than salmon. |
Supporting Evidence
- Karvonen, A., O. Seppälä, and E. T. Valtonen. 2004. "Eye Fluke-Induced Cataract Formation in Fish: Quantitative Analysis Using an Ophthalmological Microscope." Parasitology 129 (4): 473–78. https://doi.org/10.1017/s0031182004006006.
- Kuukka-Anttila, H., N. Peuhkuri, I. Kolari, T. Paananen, and A. Kause. 2009. "Quantitative Genetic Architecture of Parasite-Induced Cataract in Rainbow Trout, Oncorhynchus Mykiss." Heredity 104 (1): 20–27. https://doi.org/10.1038/hdy.2009.123.
- Nilsson, Jonatan, et al. 2025. "Laksvel — a Standardised, Operational Welfare Monitoring Protocol for Atlantic Salmon Held in Sea Cages." Institute of Marine Research. https://www.hi.no/en/hi/nettrapporter/rapport-fra-havforskningen-en-2025-40.
- Noble, C., et al. 2020. "Welfare Indicators for Farmed Rainbow Trout: Tools for Assessing Fish Welfare." Nofima. https://nofima.no/wp-content/uploads/2020/05/Welfare-Indicators-for-farmed-rainbow-trout-Noble-et-al.-2020.pdf.
- Remø, Sofie Charlotte, et al. 2017. "Lens Metabolomic Profiling as a Tool to Understand Cataractogenesis in Atlantic Salmon and Rainbow Trout Reared at Optimum and High Temperature." PLOS ONE 12 (4): e0175491. https://doi.org/10.1371/journal.pone.0175491.
- Wall, T., and E. Bjerkas. 1999. "A Simplified Method of Scoring Cataracts in Fish." Bulletin of the European Association of Fish Pathologists 19 (4): 162–65.
- Weirup, Lina. "Development of a Fish Welfare Evaluation Index for Rainbow Trout (Oncorhynchus mykiss) in Aquaculture." PhD Thesis, 2022. https://d-nb.info/1262308445/34.